


Public Debt as Distinct from Corporate Debt
By Mitchell Vexler, August 7, 2025
Through the past several months of research, quite often a key word trips a thought process, which causes additional research and expansion of previous articles I wrote. This article falls under such expansion, with the goal to add clarity of why we are where we are and how not to fall prey to the narrative.
Economic trends are critical drivers of the bond market’s performance. But the economy affects bonds in many ways; it depends on their exposure to interest rate risk. Like other investment types, bonds are tied to the state of the economy, because the businesses and governments that issue them exist within that economy.
Bonds affect the economy, and the economy affects bonds. Here's how they are related as well as how they impact each other.
How Economic Growth Works
Economic growth occurs when a country increases its rate of economic output, which is known as "gross domestic product" (GDP). GDP is the most commonly used measure of an economy's performance. A positive change in GDP means economic growth; a negative change means shrinkage.
Gross domestic income (GDI) measures income earned and costs incurred. It is used in conjunction with GDP.
When the economy grows, the demand for money rises. More money is demanded, because there are more products and services available. People can spend more, since the employment rate and wages often rise along with growth.
Interest Rate Risk
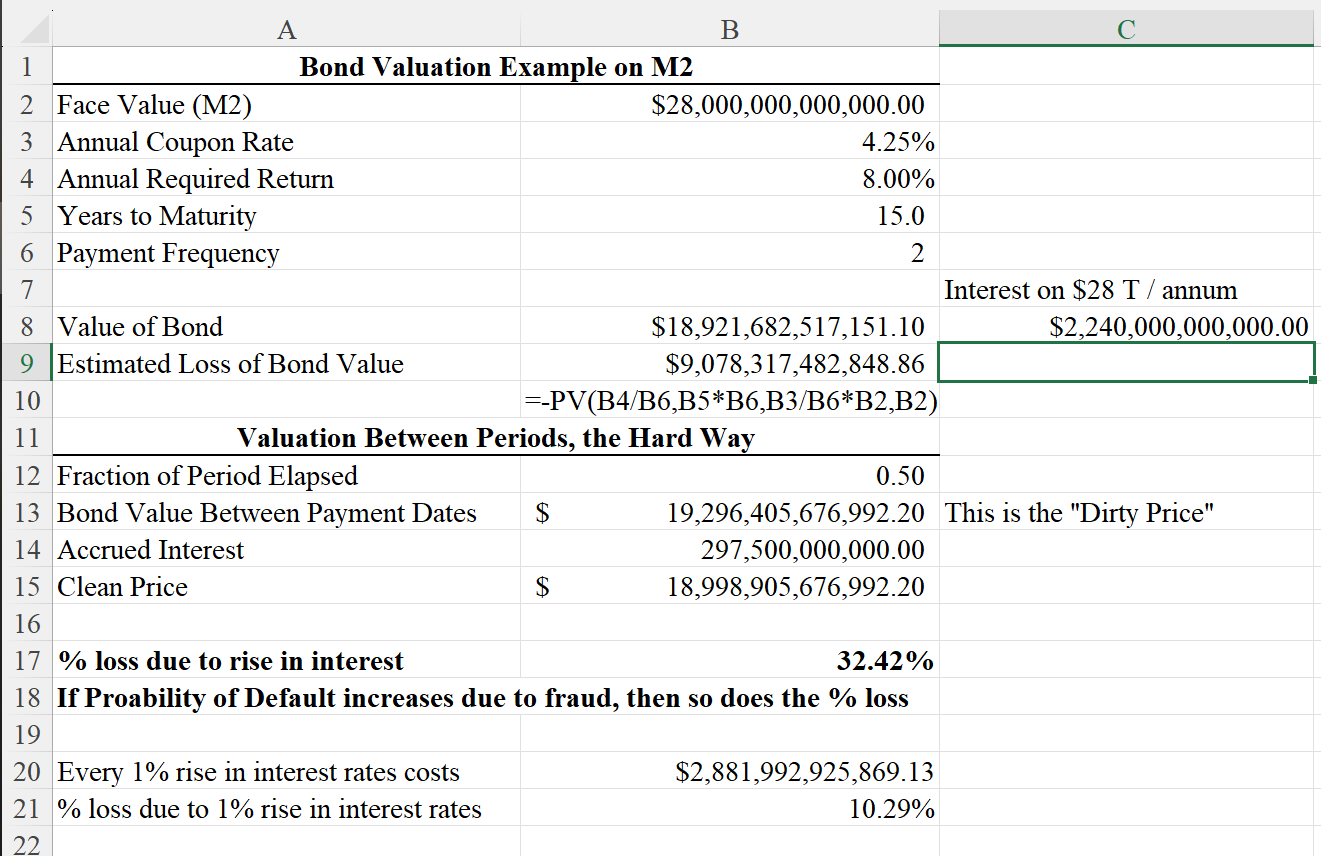
Interest rate risk means that bond returns vary based on the amount of fluctuation in interest rates. The amount of risk added to a bond through interest rate changes depends on a few factors: how much time until the bond matures, the bond's coupon rate, or its annual interest payment.
The longer you hold a bond, the more risk you accept. This risk only applies to investors who do not hold the bond to maturity. If you decide to sell the bond to a third party before maturity, then the fluctuation of interest rates matters. If interest rates have risen since you first bought the bond, then you will likely have to sell it for less than you paid for it in the first place. That’s because bond prices and interest rates are inversely related. This article does not intend to get into hedging bond holdings via trading around those holdings, but one should understand that there are options to consider.
How Economic Growth Impacts Bonds
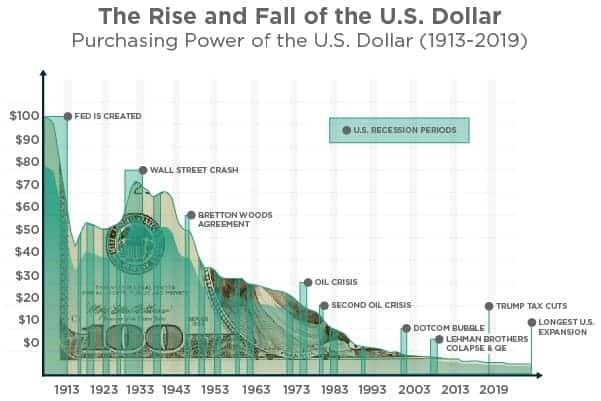
Higher currency demand causes inflation, which is the reduction of a currency's purchasing power. In other words, an item worth $1 today might be worth less than $1 a week from now. To combat inflation, the Federal Reserve (the Fed) uses monetary policy tools. These include interest on required reserves, overnight reverse repurchasing, and the discount rate (Reverse Repo). These tools help influence the federal funds rate, which then impacts interest rates. I have written about the reverse (perverse) repo, see the links below. I have also written that the Feds manipulations are nothing more than a 50-50 coin toss.
When interest rates rise, bond prices fall. When interest rates fall, bond prices rise. Bond yields rise when interest rates rise and drop when rates fall.
Rising interest rates can make investors more interested in stocks because bonds sell for less. Slower economic growth reduces the demand for money. That's because individuals and businesses are less likely to take out loans to finance projects and purchases.
Lower demand for loans causes prices to fall and interest rates to rise. Bonds can then become more attractive than stocks because of their fixed yields.
U.S. Treasurys are considered benchmarks for bond performance, that being the alleged “risk free rate of return”.
Some types of bonds other than Treasurys benefit from stronger economic growth rather than being hurt by it. These segments often include high-yield bonds, emerging markets bonds, and lower-rated corporate bonds. The yields on these bonds are high enough that modest fluctuations in Treasury yields have less of an impact. However, the correlation between severe losses and economic downturn become closer to 1 as the volatility increases in both as the market turns negative.
U.S. Treasurys are used as benchmarks because they are considered by the institutions reliable. However, one must study why they are considered reliable. Who is getting the benefit? Where did the money come from to fund the portfolio holdings? What are the probabilities?
Corporate bonds and emerging markets trade based on their credit ratings, which are driven by their financial strength. The stronger their balance sheets, cash balances, and business trends, the less likely they are to default (miss a payment) and the less likely they are to required bonds to begin with.
The lower the chance of a bond default, the lower the yield you can expect. Investors require a higher yield when the chance of bond default is elevated, but they are willing to accept less if the chance of default is remote. This comes full circle to the book Security Analysis by Graham & Dodd. Graham was the teacher to Warren Buffett. There are many good books including The Bond Book, but in my humble opinion this is by far the best book on how to understand the valuation of debt and its impact on a company and thinking forward, on society.
A stronger economy lowers returns on Treasurys and bonds, but it is much more likely to be a positive factor for higher-yielding bonds where the issuer’s creditworthiness is a major concern. This difference helps make a case for diversification. It's a wiser option than concentrating your holdings in any single segment of the bond market. As I stated in multiple videos the 60-40 Stock to bonds is complete nonsense. Diversification is a topic which the reader should study in depth.
Key Takeaways
- Each one of the above paragraphs is a story in and of itself deserving of a deep dive.
- Economic performance affects interest rates.
- Interest rates affect bond performance.
- Bond prices fall as interest rates rise, and vice versa.
- Bond yields rise and fall opposite of prices.
- How Do Market Interest Rate Fluctuations Affect a Bond's Coupon?
- Is the Bond Coupon temporarily manipulated by narrative vs the quantifiable risk?
Regardless of how the broader market fluctuates, a bond's coupon remains consistent (unless the bond is inflation-protected). The coupon is the dollar value of the payments you receive. As the bond market fluctuates, the price of your bond may rise or fall. If it rises, then the yield rate will decrease, because the coupon doesn't increase in step with the bond price. This doesn't significantly impact bondholders who plan on buying and holding bonds until maturity. Do you know where your invested money in bonds is??
Is a Recession Good for Bonds?
During a recession, interest rates typically fall as demand for new borrowing dries up. Because bond prices are inversely related to interest rates, this suggests that bond prices will rise during a recession. Note, however, that bond prices are also sensitive to credit and default risk, so if a recession also harms borrowers' ability to repay, it can hurt bond prices.
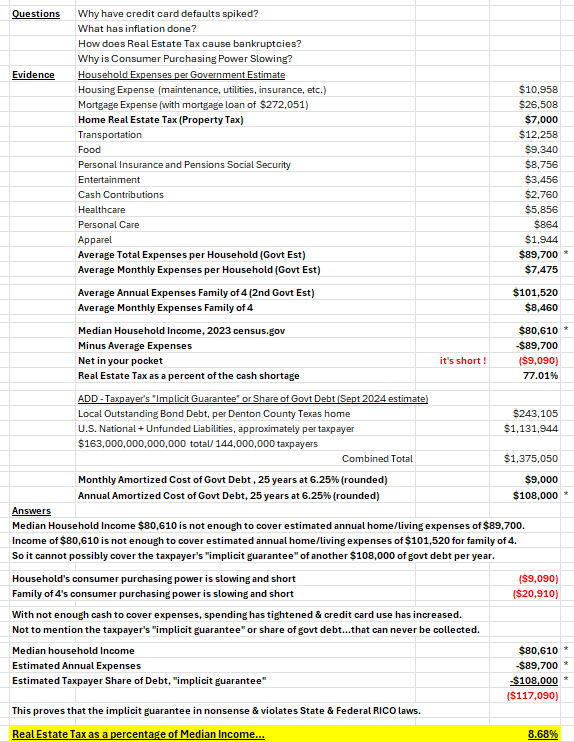
We are clearly in a recession. Look around. Mom and Pop are out of money. 37.8%+ of the households are in harms way of bankruptcy or losing the roof over their head. The worse the recession becomes, the higher the probability of bond defaults, especially with regard to the school district bonds.
School Bonds (Fraud on society):
Not backed by assets owned by a school district.
The assets to the school are the property owners. The properties of the school districts are levered to the hilt, as are the property owners, to pay the fraudulent property taxes to cover the outstanding interest on the fraudulent bonds.
There is no economic benefit derived from the school district bonds into society as if it were a company producing goods and services. Yes, children are supposed to get an education, but the vast majority of schools are failing in that goal. Further, the current bond raises are not for any children but are to support the interest on the outstanding fraudulent bonds which in Texas is roughly $660 Billion.
As Jack Salmon stated, “The key policy question, therefore, is not whether public debt is inherently good or bad, but rather under what conditions it becomes harmful to long-run economic performance.”
Below, I have inserted excerpts from the article, The Impact of Public Debt on Economic Growth: A Living Review, by Jack Salmon, Research Fellow at Mercatus Center, published 8/6/2025 (updated on 8/13/25), on mercatus.org. I have underlined what is critical to understand, all of which I have stated on multiple videos.
[Begin text excerpt from Jack Salmon article]
Theoretical Context
Since the 1960s, neoclassical economists have noted how increases in taxation to finance interest payments on the nation’s growing domestic and foreign government debt negatively affect gross capital stock formation (Diamond 1965). Keynesian economists, meanwhile, have argued that rising public debt induces productive public spending and has a positive multiplier effect on the economy (Furman and Summers 2020). New Keynesian models have further refined the Keynesian view by focusing on the relationship between the interest rate on government debt and the economy’s growth rate: If the average interest rate remains below the growth rate, it is argued, governments can sustain higher debt levels without triggering fiscal instability or crowding out effects (Blanchard 2019).
While recent years have seen renewed interest in the relationship between public debt and economic growth, economists have long theorized about the various channels through which public debt may affect growth.
One such channel is Ricardian Equivalence, which implies substitutability between public debt and the future tax burden (Barro 1974). Higher future distortionary taxes detract from the private savings and investment. In this sense, a growing burden of public debt reduces the capital stock to a level lower than it would in the absence of bad fiscal management. If government cuts taxes, it reduces public saving, but it also raises the after-tax income of households. Depending on the marginal propensity of households to consume, some of this windfall will be spent, but part of it will also be saved. If consumers typically spend half of a windfall, the remaining half will be saved. This scenario suggests that a $1 increase in the deficit leads to a $0.50 decrease in national saving (public saving + private saving [-1 + 0.5 = -0.5]). In an open economy, total savings can be rearranged from the national income identity in the equation S = I + NX.
The subsequent decline in national saving reduces the supply of funds available to private borrowers, and the reduced supply pushes up the interest rate for private borrowing. Facing higher interest rates, households and businesses reduce private investment. Reduced private investment means the nation’s capital stock is smaller than it would be in the absence of deficit spending, reducing the standard of living for American households.
The degree to which increased federal budget deficits crowd out private investment depends on how much the reduction in public saving is offset by higher private saving and increased net inflows of foreign capital. If neither private saving nor foreign capital inflows rise sufficiently, higher government borrowing will raise interest rates and reduce private investment. The Congressional Budget Office (CBO) estimates that each additional dollar of deficit spending reduces private investment by between 15 and 50 cents, with a central estimate of 33 cents.
Another channel through which growing public debt crowds out economic growth is higher long-term interest rates. As the government borrows more to finance growing budget deficits, it competes with the private sector for available savings in the loanable funds market. This increased demand for credit pushes up the real interest rate and subsequently reduces the level of private investment. The private investment decline resulting from debt crowd out reduces the amount of capital per worker and further increases interest rates and the return on capital over time. Higher interest rates have a negative ripple effect throughout the economy, as private lenders use Treasury yields as a benchmark to set their own lending rates. As the table below demonstrates, most empirical studies find that each percentage point increase in the public debt ratio raises long-term interest rates by 3 to 5 basis points (Salmon 2025).
A third channel through which a growing public debt burden crowds out economic growth is through the inflation and credit risk premium. If investors believe that a high and rising debt burden will eventually be monetized (i.e., financed by money creation), the risk of higher future inflation becomes more immediate (Cochrane 2023). To compensate for the additional inflation risk, investors demand a higher inflation risk premium in nominal bond yields.
If inflation rises unexpectedly, as it did during the 2021–23 inflation surge, bondholders receive repayments in devalued dollars, reducing the real purchasing power of their interest and principal. This makes government debt less attractive unless yields rise to compensate. As a result, the government must offer higher nominal interest rates to entice buyers, thereby increasing the cost of servicing the debt. Moreover, inflation introduces uncertainty about the future purchasing power of returns, heightening volatility and risk in financial markets. This uncertain environment can stifle long-term investment and reduce capital formation, as investors shift toward inflation-protected or shorter-duration assets. This shift can reduce funding for private sector projects that promote productivity and growth.
Additionally, persistent inflation can trigger a loss of confidence in the government’s fiscal and monetary credibility. If markets believe that policymakers are either unable or unwilling to contain inflation, risk premiums can rise not only due to inflation expectations but also due to fears of fiscal dominance, where monetary policy becomes subordinated to the needs of the fiscal authority. This concern is reflected in the sovereign credit risk premium, further compounding the cost of borrowing.
At the intersection of competing Keynesian and neoclassical views lies the hypothesis of nonlinear or threshold effects, which posits that debt may promote growth at low levels but hinder it once a critical threshold is crossed. This “inverted U” hypothesis reconciles Keynesian stimulus with neoclassical concerns by suggesting that the impact of debt on growth is conditional on the level of debt, debt trajectory, and broader macroeconomic context (Reinhart and Rogoff 2010). In this view, the relationship is not static or mechanical but shaped by factors such as investor confidence, institutional strength, and monetary policy credibility. What constitutes a “safe” or “dangerous” level of debt may vary considerably across countries and over time. Estimates of the debt threshold beyond which growth deteriorates vary widely in the economic literature, from as low as 50–60% of GDP for developing countries to 70–100% for developed countries.
Survey Sample Scope
[Comment by MV – Each of the organizations listed below are highly suspect with regard to narrative. It is the math from which the truth is evident, not the organization.]
This survey reviewing the relationship between public debt and economic growth draws upon empirical studies that utilize internationally recognized macroeconomic datasets, including the World Bank’s World Development Indicators, the International Monetary Fund’s World Economic Outlook, the European Commission’s Annual Macroeconomic (AMECO) and Eurostat databases, and the OECD’s Economic Outlook. These data sources are widely regarded for their consistency, comparability, and global coverage.
To ensure generalizability and to mitigate the risk of idiosyncratic or region-specific findings, the inclusion criteria were restricted to studies examining multiple countries. Multinational samples are presumed to offer more robust insights into the relationship between public debt and economic growth by capturing cross-country variation and broader economic trends.
The survey comprises 70 studies published between 2010 and 2025, a period marked by heightened academic interest in debt-growth dynamics in the aftermath of the Global Financial Crisis and the COVID-19 pandemic. Studies were identified using targeted keyword searches in Google Scholar, including terms such as “debt and growth,” “public debt and economic growth,” and “debt growth threshold,” and were supplemented through backward and forward citation tracking. To ensure comprehensive coverage and to minimize the risk of omitting relevant contributions, an additional round of screening was conducted using an advanced AI-based research tool (Deep Research [ChatGPT 4.5]), aimed at identifying studies potentially missed by conventional methods. Only English-language publications were considered.
While the vast majority of studies (62 out of 70) appeared in peer-reviewed academic journals, the survey also includes a select number of working papers and policy reports (8 out of 70) issued by reputable institutions such as the Federal Reserve Bank, the Bank for International Settlements, International Monetary Fund, and the World Bank. These non-peer-reviewed sources were included due to their empirical rigor and institutional credibility.
The studies surveyed employ a range of empirical strategies. Most utilize panel data, which offer advantages in accounting for unobserved heterogeneity and improving the precision of estimated effects. Others apply time-series, cross-sectional, or hybrid methodologies. Estimation techniques vary, with both linear and nonlinear regression models represented. Many studies are framed within endogenous or neoclassical growth model frameworks, reflecting the prevailing theoretical underpinnings of the literature.
Summary of Empirical Literature
The table below summarizes the sample of 70 studies from the empirical literature. In total, 48 of the studies attempt to measure the nonlinear threshold at which debt starts to have increasingly deleterious impacts on growth, while 22 studies do not attempt to find a threshold. Among the 48 studies that seek a threshold, 42 find a nonlinear threshold, while 6 do not find a threshold. Of the 70 studies, 47 offer quantitative estimates of the impact of debt on growth, while 23 do not measure this impact quantitatively. Among the 47 studies that do measure this impact, 45 find negative growth effects of increasing public debt, while only 2 studies find no effect of public debt on growth.
Synthesizing the Findings of the Literature
While the bulk of empirical literature suggests that high and increasing levels of public debt have a negative impact on economic growth, the scale of the debt drag effect varies widely between studies. Similarly, the vast majority of studies attempting to find a nonlinear threshold effect do find the existence of a nonlinear threshold, but the range of estimates is broad, typically between 60% and 100%. Consistent with prior literature, the evidence for a nonlinear debt-growth threshold suggests that, while such thresholds might exist, there may not be a common threshold level, and they may be largely dependent upon other factors such as a country’s level of development and the quality of its institutions.
Among the 42 studies that find nonlinear threshold levels at which debt begins to adversely affect economic growth, mean and median threshold levels can be calculated. The mean threshold level is 74% of GDP, while the median threshold is 76%. If we remove estimates from developing country samples to focus on the threshold level for advanced economies, the mean and median threshold levels are marginally higher, at 75% and 77% respectively. These estimates are largely consistent with prior estimates for advanced countries, with mean and median threshold levels at 78% and 82%of GDP, respectively (Salmon 2021).
As mentioned, studies that estimate the quantitative impact of debt on growth offer a wide range of estimates. One way to narrow down the central tendency of growth effects is to use a meta regression approach based on the precision of estimates. Using the REML (restricted maximum likelihood) approach better accounts for differences across studies (heterogeneity) while computing an average effect. Among the studies that measure the impact of debt on economic growth, 171 estimates with confidence intervals are included in the meta-analysis. The results suggest that each percentage point increase in the public debt ratio reduces economic growth by 1.34 basis points.
Given that the current level of public debt in the United States is around 120% of GDP, and the nonlinear threshold level was crossed in 2020, the central estimate can be used to calculate that economic growth is roughly 0.27 percentage points lower today thanks to the debt drag. In other words, if real GDP growth in 2025 is 2%, it would have been closer to 2.3% if the debt had stayed at 2019 levels. Using the latest CBO long-term budget projections, economic growth in 2055 is estimated to be about 1 percentage point lower thanks to the debt drag. [https://fred.stlouisfed.org/series/gfdegdq188S (Link Inserted by MV)]
Small differences in economic growth have serious implications for long-term changes in living standards. An economy that grows at 3% per year doubles in size every 23 years, while an economy that grows at 2% per year takes 35 years to double in size. The figure below shows how small differences in average growth rates since 1972 would have meant US GDP per capita being notably smaller over time. A 1% lower growth rate would mean that Americans in 2022 had the same standard of living as Italians.
Conclusion
This survey has reaffirmed a clear and consistent empirical finding: Higher public debt levels are associated with slower economic growth, particularly when debt ratios exceed a critical range. While the precise threshold varies across studies and contexts, the bulk of the evidence places it between 75 and 80% of GDP for advanced economies—a level that the United States has materially exceeded since 2020. This matters, not because debt is inherently destructive, but because its long-run accumulation imposes tangible costs: reduced private investment, upward pressure on interest rates, and heightened inflation and credit risk premia.
Moreover, the meta-analytic estimate indicating a 1.34 basis point decline in growth for each additional percentage point of debt-to-GDP above this threshold implies a cumulative drag that compounds meaningfully over time. Even seemingly modest reductions in growth have profound implications for future living standards, economic resilience, and fiscal space.
The evidence underscores the need for strategic fiscal prudence, especially in non-recessionary periods. Policymakers should avoid interpreting low borrowing costs as a permanent license to expand debt without consequence. Instead, the central question should be: Are today’s deficits delivering returns that justify tomorrow’s drag on growth?
Future research would do well to further disaggregate the debt-growth relationship by institutional quality, demographic pressures, and types of government spending. But the current weight of the literature supports a key takeaway: For advanced economies seeking sustainable prosperity, keeping debt below 80 percent of GDP should remain a guiding principle. That is not an arbitrary target, but an empirically grounded threshold supported by the accumulated work of dozens of independent studies over the past 15 years.
[End of text excerpt from Jack Salmon’s article]
Articles by Mitchell Vexler on these and other related topics:
- https://www.mockingbirdproperties.com/the-data-is-cooked
- https://www.mockingbirdproperties.com/fed-analysis-cpi-the-ultimate-big-lie
- https://www.mockingbirdproperties.com/the-u-s-debt-modern-monetary-theory
- https://irp.cdn-website.com/39439f83/files/uploaded/School_Districts_and_Accounting_Fraud_-_Presentation_to_President_Trump_and_Elon_Musk.pdf
This one chart, shows what is happening to the outstanding fraudulent school district bond debt on your house. Outstanding fraudulent school district bond debt in your district divided by the number of houses in your district. The math is applicable across the U.S. = roughly $5.1 Trillion in outstanding fraudulent school district bond debt which cannot be paid off today never mind tomorrow. The vast majority of school districts are bankrupt and taking the property owners with them. The median household income does not exist to pay off the fraudulent bonds.
Solution... Repeal Real Estate Tax in favor of Uniform States Sales Tax